---
title: Wildfires, Insurer Withdrawal, and the Expansion of FAIR Plans in California
subtitle: Data Analytics Capstone Project
author:
- name: Ann Brennan
affiliation: SUNY Geneseo
date: last-modified
execute:
echo: true
eval: true
warning: false
message: false
fig-width: 10
fig-height: 6
format:
html:
code-fold: true
toc: true
toc-title: "Contents"
toc-expand: 3
number-sections: true
code-tools: true
highlight-style: atom-one
editor:
markdown:
wrap: 72
---
```{r setup}
#| include: false
library(sf)
library(ggplot2)
library(dplyr)
library(tidyr)
library(tigris)
library(viridis)
library(stargazer)
library(tidyverse)
library(fixest)
library(skimr)
library(hrbrthemes)
library(modelsummary)
theme_set(theme_ipsum()+
theme(strip.background =element_rect(fill="lightgray"),
axis.title.x =
element_text(angle = 0,
size = rel(1.33),
margin = margin(10,0,0,0)),
axis.title.y =
element_text(angle = 90,
size = rel(1.33),
margin = margin(0,10,0,0))
)
)
```
```{r visualizations}
#| include: false
df <- read.csv("C:/Users/15856/Documents/merged-dataset-clean.csv")
# 1. Wildfires, Non-Renewals, and FAIR Plan Enrollment Over Time
# aggregate by year
time_data <- df |>
group_by(year) |>
summarize(
wildfire = sum(acres_burned, na.rm = TRUE),
nonrenewal = sum(voluntary_non_renewed_insurer_initiated, na.rm = TRUE),
fair = sum(fair_policies, na.rm = TRUE)
)
# standardize variables
time_data <- time_data |>
mutate(
wildfire_scaled = scale(wildfire),
nonrenewal_scaled = scale(nonrenewal),
fair_scaled = scale(fair)
)
# reshape to long format
time_long <- time_data |>
select(year, wildfire_scaled, nonrenewal_scaled, fair_scaled) %>%
pivot_longer(
cols = -year,
names_to = "variable",
values_to = "value"
)
# rename variables
time_long$variable <- recode(time_long$variable,
wildfire_scaled = "Wildfire Activity",
nonrenewal_scaled = "Non-Renewals",
fair_scaled = "FAIR Plans"
)
# 2. Maps - Wildfires, Non-Renewals, and FAIR Plans (2021)
# load shapefile for ca counties
ca_counties <- st_read("C:/Users/15856/Downloads/ca_counties/CA_Counties.shp")
# enable cache
options(tigris_use_cache = TRUE)
# filter - only 2021 data
data_2021 <- df |>
filter(year == 2021)
# check county names before merging
unique(ca_counties$NAME)[1:10]
unique(df$county)[1:10]
# standardize county names for merging
ca_counties <- ca_counties |>
mutate(NAME = toupper(NAME))
# merge data with shapefile
map_data <- ca_counties |>
left_join(data_2021, by = c("NAME" = "county"))
# create log transformed variables and rename
map_data <- map_data |>
mutate(
wildfire = log(acres_burned_lag1 + 1),
fair = log_fair_policies,
nonrenewal = log(voluntary_non_renewed + 1)
)
# reshape data
map_long <- map_data |>
select(NAME, geometry, wildfire, fair, nonrenewal) %>%
pivot_longer(
cols = c(wildfire, fair, nonrenewal),
names_to = "variable",
values_to = "value"
)
# rename variables for visual
map_long$variable <- recode(map_long$variable,
wildfire = "Wildfire (Log Acres Burned, Lagged)",
fair = "FAIR Plan Policies (Log)",
nonrenewal = "Non-Renewals (Log)"
)
# standardize variables
map_long <- map_long |>
group_by(variable) |>
mutate(value_scaled = scale(value)) %>%
ungroup()
```
```{r models}
#| include: false
# ------- FE Panel Regression --------------
# Outcome variable: log FAIR Plans
# log transformation
df <- df |>
mutate(
log_acres_burned = log(acres_burned + 1),
log_non_renewed = log(voluntary_non_renewed_insurer_initiated + 1)
)
# run model
model <- lm(
log_fair_policies ~ log_acres_burned +
log_non_renewed +
median_income +
housing_units +
median_home_value +
factor(county) + factor(year),
data = df
)
# Outcome variable: log Non-Renewals
# log transformation
df <- df |>
mutate(
log_acres_burned = log(acres_burned + 1),
log_non_renewed = log(voluntary_non_renewed_insurer_initiated + 1)
)
# run model
model2 <- lm(
log_non_renewed ~ log_acres_burned +
median_income +
housing_units +
median_home_value +
factor(county) + factor(year),
data = df
)
# -------- Linear Regression ---------------
## Outcome variable: log FAIR Plans
# year fe model
model_year_fe <- feols(
log(fair_policies) ~ log(acres_burned_lag1) + log(voluntary_non_renewed_insurer_initiated) +
median_income + housing_units + median_home_value | year,
data = df
)
# county fe model
model_county_fe <- feols(
log(fair_policies) ~ log(acres_burned_lag1) + log(voluntary_non_renewed_insurer_initiated) +
median_income + housing_units + median_home_value | county,
data = df
)
# two-way fe model
model_both_fe <- feols(
log(fair_policies) ~ log(acres_burned_lag1) + log(voluntary_non_renewed_insurer_initiated) +
median_income + housing_units + median_home_value | year + county,
data = df
)
# set seed
set.seed(123)
# split train/test
train_data <- df[df$year < 2020, ]
test_data <- df[df$year >= 2020, ]
# train model
model_test <- feols(
log(fair_policies + 1) ~ log(acres_burned_lag1 + 1) +
log(voluntary_non_renewed_insurer_initiated + 1) +
median_income + housing_units + median_home_value | county,
data = train_data
)
# generate predictions
preds <- predict(model_test, newdata = test_data)
# actual values
actual <- log(test_data$fair_policies + 1)
```
# Introduction
In recent years, wildfires have become more frequent and severe across
the western United States, particularly in California. This has
contributed to growing economic costs for households, insurers, and
policymakers. These events have also begun to reshape the functioning of
private insurance markets in California. As wildfire risk increases,
insurers face rising claims and uncertainty, causing many to reassess
their exposure in high-risk areas. This is visible in an increase of
policy non-renewals. This means insurers choose not to continue coverage
for existing customers. This shift raises concerns about access to
insurance and the stability of housing markets in wildfire-prone areas.
Homeowners who are unable to obtain or maintain private coverage must
turn to alternative options. The most prominent alternative is
California’s FAIR (Fair Access to Insurance Requirements) Plan. The FAIR
Plan is a state-mandated insurer of last resort designed to provide
basic property insurance to high-risk properties that cannot acquire
coverage in the private market. It serves as an important safety net,
however, FAIR Plan coverage is typically more expensive and offers
limited protection compared to standard policies. As a result, increased
reliance on the FAIR Plan may signal instability in the insurance market
and create financial burdens for homeowners.
This project examines the relationship between wildfire activity,
insurer behavior, and the expansion of FAIR Plan coverage in California.
The primary research question is: **How does wildfire activity affect
insurer non-renewals, and how do non-renewals drive FAIR Plan growth?**
This question aims to help understand how climate-related risks
translate into market outcomes and policy challenges.
To answer this question, this study uses a county-year level dataset
covering all 58 counties in California from 2015 to 2021. This dataset
combines information from multiple data sources, including the
California Department of Insurance (CDI), which provides data on insurer
non-renewals and FAIR Plan policy counts. It also includes Cal Fire,
which provides measures of wildfire activity such as acres burned, and
the U.S. Census Bureau, which contributes socioeconomic controls
including housing units, median home value, and median income. The unit
of observation is county-year, allowing for analysis of changes within
counties over time while accounting for differences across regions.
The main empirical methods will be a fixed effects panel regression and
linear regression model. These models will be used to estimate
relationships between the variables of interest. County fixed effects
control for time-invariant characteristics such as geography, baseline
fire risk, and existing economic conditions. Year fixed effects control
for statewide shocks, including severe wildfire seasons or changes in
state insurance requirements. By isolating variation within counties,
this framework focuses on the effect of changing wildfire activity on
insurer non-renewals and their subsequent impact on FAIR Plan
enrollment. This analysis aims to provide more credible estimates of
these relationships by concentrating on variation within counties over
time.
The results of this analysis indicate that increased wildfire activity
may be associated with higher insurer non-renewals. This suggests that
insurers reduce their exposure in response to greater risk.
Additionally, higher non-renewal rates are associated with increased
FAIR Plan enrollment. This indicates that homeowners who lose their
private coverage turn to the FAIR Plan as an insurer of last resort.
Overall, the results suggest that climate-related risk is pushing
homeowners away from private insurance and toward FAIR Plan coverage.
However, there are significant trade-offs associated with this shift, as
FAIR Plan policies are often more expensive with less coverage.
The findings of this project have important implications for multiple
stakeholders. For the insurance industry, the results highlight the
challenges of maximizing profits and managing risk with increasingly
severe wildfire incidents. For policymakers, the expansion of FAIR Plan
enrollment suggests that the program is functioning as intended for the
short-term, however, this is not a long-term solution. The FAIR Plan
program is intended as a temporary safety net, and may not be
sustainable if homeowners continue to increase reliance on it. For
housing markets, rising non-renewals and higher insurance costs may
reduce property values, limit mortgage availability, and reduce housing
availability in high-risk areas. Overall, this project contributes to
the understanding of how environmental risk is associated with and
translates to market changes and policy responses. It also provides
evidence that can inform future decisions about insurance regulation,
climate risk management, and housing policy in wildfire-prone regions.
# Background and Related Literature
Wildfire risk has become an increasingly important issue for insurance
markets in California. As wildfires have become more frequent and severe
over time, the cost of insuring high-risk properties has increased. This
impacts and creates challenges for insurers, policymakers, and
homeowners. In response to increased wildfire risk, insurers may
increase premiums or completely withdraw from high-risk areas. When
homeowners lose or cannot obtain private insurance, they often rely on
“insurers of last resort”, such as California’s FAIR Plan. This state
mandated program provides basic coverage to high-risk properties to
ensure homeowners can still meet mortgage and legal requirements.
Prior research shows that wildfire risk generates significant economic
costs with implications for housing, land use, and risk management.
Literature by Bayham et al. (2022) provides a comprehensive review of
the economics of wildfires in the United States, documenting the scale
of damage and incentive challenges in high-risk areas. At the same time,
work by Boomhower, Fowlie, and Plantinga (2023), shows that insurance
markets also shape risk mitigation behavior. A key finding is that
insurer discounts for risk mitigation can help households learn about
ways to reduce their own losses. This suggests that insurance influences
how people respond to risk.
More recent work focuses on how climate risk is reshaping housing
insurance markets. Keys and Mulder (2025) show that increased climate
disaster risk is reflected in insurance and mortgage data, with insurers
adjusting coverage and pricing in response to perceived risk and
exposure in the long run. Similarly, Fowlie et al. (2025) highlight that
climate change is affecting home insurance markets through rising
premiums, coverage restrictions, and insurer withdrawal in high-risk
areas. These findings support the idea that insurance markets may become
less stable as climate risk increases.
California’s FAIR Plan is generally viewed as an important safety net,
but also interpreted as a signal of instability in the private insurance
market. Auer (2024) emphasizes that as wildfire risk increases, insurers
have started to restrict coverage or exit high-risk areas, which has
important implications for both policymakers and homeowners. Overall,
this literature suggests that insurer behavior plays a key role in how
wildfire risk translates to insurance access.
Important gaps still remain in the existing research. Most of the
existing literature focuses on either insurance pricing or broad market
outcomes, with less emphasis on specifically how non-renewals connect
wildfire exposure to the expansion of insurers of last resort.
Additionally, there is limited county-level evidence linking wildfire
activity, insurer withdrawal, and FAIR Plan enrollment over time. This
project contributes to existing literature by using a county-year panel
dataset to examine the relationship between wildfire activity, insurer
non-renewals, and FAIR Plan growth in California. This provides more
evidence on the role of insurer behavior as a connection between climate
risk and insurance market outcomes.
# Data
## Data Sources
This analysis combines data from three primary sources to create a
county-level panel dataset with wildfire activity, insurance policy
outcomes, and socioeconomic features in California. First, the data on
insurer non-renewals and FAIR policy counts are obtained from the
California Department of Insurance (CDI). The CDI collects this
information to monitor insurer behavior. Their goal is to protect
consumers and keep the insurance market stable. This data provides
annual counts of non-renewed policies, as well as new and renewed FAIR
Plan policies at the county level.
Second, wildfire activity data is collected from the California
Department of Forestry and Fire Protection (Cal Fire). This dataset
includes measures of wildfire severity in California, such as total
acres burned per county and year. Cal Fire collects this data for fire
management, risk assessment, and public reporting purposes. It is a
widely used source for analysis on wildfires.
Third, socioeconomic characteristics are obtained from the U.S. Census
Bureau, specifically the American Community Survey (ACS). The ACS
provides annual estimates on features such as median household income,
median home value, and total housing units. These variables are included
to control for differences in economic conditions and housing markets
across counties in California.
All three datasets were accessed online in March of 2026 and merged by
county and year. The new dataset allows for a comprehensive analysis of
how the relationships between wildfire risk, insurer behavior, and
socioeconomic characteristics change over time.
## Unit of Observation
The unit of observation in this project is the **county-year**. Each row
in the dataset represents one California county observed in a given
year. The dataset includes 58 counties observed over the period from
2015 through 2021. The final panel contains 438 observations.
## Sample and Scope
The sample includes all 58 counties in California over the period from
2015 through 2021. This time frame captures multiple major wildfire
seasons in order to analyze the relationship between wildfire risk and
insurance market outcomes. The dataset includes three different variable
categories: insurance market outcomes (non-renewals and FAIR Plan
policies), wildfire activity (acres burned), and socioeconomic controls
(income, home value, and housing units). The final dataset is structured
as a county-year panel, where each observation corresponds to a specific
county in a given year.
## Data Cleaning
In order to construct the final dataset, it is necessary to clean and
filter the data. First, wildfire data is spatially joined with
California county boundaries using geographic information system (GIS)
methods. Each wildfire perimeter is assigned to the counties it
intersects in order to link fires with specific geographic areas. The
fire-level data is then aggregated to the county-year level by summing
the total acres burned and summing the number of fires.
Second, the wildfire dataset is filtered to include only the years 2014
through 2021. The year 2014 is included to construct a one year lag of
wildfire activity, specifically acres burned lagged by one year. This
approach links each year’s wildfire exposure to insurer behavior in the
following year. The lag structure reflects the fact that insurers do not
respond immediately. Instead, they typically adjust their policies in
the subsequent plan year after observing wildfire losses from the prior
year.
Third, missing values for acres burned and number of fires are replaced
with zeros. Counties with zero wildfire activity are still included in
the dataset, serving as a baseline group for the analysis.
Next, insurance data from the California Department of Insurance is
cleaned and transformed. County identifiers are standardized, and
character variables are converted to numeric format where necessary.
FAIR Plan coverage is constructed by combining the number of new and
renewed FAIR Plan policies into a single measure of total FAIR Plan
policies. It is important to note that the number of non-renewals are
insurer initiated, and exclude those initiated by consumers to
exclusively reflect insurer behavior.
Additionally, socioeconomic control variables are obtained from the
American Community Survey and reshaped into the county-year panel
format. The control variables are merged with the insurance and wildfire
datasets using consistent county-year identifiers.
Finally, a few key variables are transformed for analysis. Log
transformations are applied to skewed variables including FAIR Plan
policies, lagged acres burned, and non-renewals.
## Key Variables
The primary outcome variables in this analysis aim to capture both
insurer behavior and reliance on an insurer of last resort. The first
outcome, insurer non-renewals, is measured as the number of policies not
renewed by insurers in a given county-year. The second outcome, FAIR
Plan policies, is the sum of new and renewed FAIR Plan policies. This
represents a total count of participation in the FAIR Plan. The main
explanatory variable is wildfire activity, which is measured as total
acres burned in a county-year. A lagged version of this variable is used
to reflect the timing of insurer responses. Insurer non-renewals are
also included as an explanatory variable when the outcome is FAIR Plan
policies. Control variables include median household income, median home
value, and total housing units. These variables account for differences
in economic conditions and housing markets across different counties.
## Data Quality and Limitations
Although this dataset is constructed from credible administrative
sources, it is important to note its limitations. First, the measure of
wildfire activity is solely based on total acres burned, which may not
fully represent perceived wildfire risk or expected future losses. For
example, insurers may respond to other variables such as proximity to
fires or anticipated risk rather than just realized damage.
Additionally, spatially assigning fires to counties based on geographic
overlap may cause measurement error, particularly for fires that spread
to multiple counties. Second, the insurance data does not include
information on premiums, underwriting criteria, or specific policy
characteristics. Because of this, the analysis does not reflect pricing
adjustments or changes in policy terms, which are notable insurer
behaviors. Third, the sample size is limited to 58 counties over seven
years, which is a relatively small panel dataset. The limited time span
may reduce the statistical power and precision of estimates. Finally,
although this analysis controls for year and county fixed effects, the
results should be interpreted as identifying strong associations rather
than definitive causal effects. Additional factors, such as policy
changes or unobserved insurer strategies, may influence the
relationships between variables.
## Data Dictionary
**fair_policies**
Number of policies enrolled in the California FAIR Plan (county-year
level).
**acres_burned_lag1**
Total acres burned by wildfires in the previous year (one-year lag).
**voluntary_non_renewed_insurer_initiated**
Number of insurance policies not renewed by insurers (excluding
consumer-initiated cancellations).
**median_income**
Median household income in the county (in dollars). Controls for local
economic conditions.
**housing_units**
Total number of housing units in the county. Controls for county size
and amount of housing.
**median_home_value**
Median value of owner-occupied housing units (in dollars). Controls for
housing market conditions.
**log_fair_policies**
Natural log of FAIR Plan policies. Used to reduce skewness.
**log_acres_burned**
Natural log of wildfire acres burned. Used to reduce skewness.
**log_non_renewed**
Natural log of insurer-initiated non-renewals. Used to reduce skewness.
## Summary Statistics
```{r summary-statistics}
df |>
  select(
    fair_policies,
    acres_burned_lag1,
    voluntary_non_renewed_insurer_initiated,
    median_income,
    housing_units,
    median_home_value
  ) |>
  skim()
```
# Empirical Strategy / Methods
## Empirical Approach
This analysis uses a combination of fixed effects panel regression and
linear regression models to examine the relationship between wildfire
activity, insurer non-renewals, and FAIR Plan enrollment. The primary
goal is to estimate how changes in wildfire exposure influence insurer
behavior, and in turn, how insurer withdrawal affects the reliance on
California’s FAIR Plan. A fixed effects structure is suitable for this
analysis because the dataset consists of observations from the same
counties over time. Counties differ in many ways, such as geography,
baseline wildfire risk, and housing market structure. These differences
may influence wildfire exposure and insurance outcomes. The model’s
county fixed effects control for these time invariant differences across
counties. Year fixed effects are included to control for statewide
shocks that would impact all counties in a given year, such as
particularly severe wildfire seasons or changes in state insurance
regulations. Additionally, a predictive modeling component is
implemented using a train-test split to evaluate out of sample
performance. This assesses how well the model can predict FAIR Plan
enrollment and insurer non-renewals based on observed variables.
## Model Specification
The primary empirical model estimates the relationship between wildfire
activity, insurer non-renewals, and FAIR Plan enrollment using a two-way
fixed effects panel regression. The outcome variable is the logarithm of
FAIR Plan policies at the county-year level. The use of a logarithm
reduces skewness while still capturing proportional changes in
relationships in FAIR Plan enrollment.
$\log({FAIR\_policies}_{it})$ $=$
$\beta_0$ $+$ $\beta_1 \log({acres\_burned}_{i,t-1})$ $+$
$\beta_2 \log({non\_renewals}_{it})$ $+$
$\beta_3 X_{it}$ $+$ $\alpha_i$ $+$ $\gamma_t$ $+$ $\varepsilon_{it}$
In this model specification, $i$ indexes counties and $t$ indexes years.
The outcome variable is the log of FAIR Plan policies in county $i$ at
time $t$. The main explanatory variables are the log of acres burned in
the previous year and the log of insurer initiated non-renewed policies.
The vector $X_{it}$ includes three control variables: median household
income, housing units, and median home value. County fixed effects
($\alpha_i$) control for time invariant county characteristics. Year
fixed effects ($\gamma_t$) control for statewide shocks impacting all
counties in a given year. The error term is denoted by
$\varepsilon_{it}$.
Additionally, alternative specifications are estimated using different
combinations of fixed effects, including models with only year fixed
effects, only county fixed effects, and both. This helps evaluate how
sensitive the results are to different sources of variation.
## Additional Outcome: Insurer Non-Renewals
This analysis also examines insurer behavior directly by estimating
models with insurer non-renewals as the outcome variable. In these
specifications, lagged wildfire activity is the primary explanatory
variable. This helps evaluate whether wildfire risk leads insurers to
withdraw from high-risk markets. This two step approach first links
wildfire activity to non-renewals and then links non-renewals to FAIR
Plan growth, which provides a more complete picture of how environmental
risk affects insurance market outcomes.
## Prediction and Model Evaluation
In addition to the panel regression analysis, a predictive modeling
technique is conducted using a train-test split. The dataset is divided
into a training sample (2015-2019) and a testing sample (2020-2021). The
linear regression model is estimated on the training data and then used
to generate predictions for FAIR Plan enrollment in the testing time
period. Model performance is evaluated using the root mean squared error
(RMSE). RMSE measures the average magnitude of errors in the prediction.
Lower RMSE values indicate better accuracy in the model’s predictions.
This approach helps show how well the model performs on new data and
whether the relationships found in the regression are useful for
prediction.
## Interpretation and Identification
The coefficients in the regression models are interpreted as
correlations between variables rather than causal effects. For example,
the coefficient for lagged acres burned represents the relationship
between changes in wildfire activity and changes in FAIR Plan enrollment
within a county, holding other factors constant. Including county and
year fixed effects strengthens the analysis by controlling for
unobserved differences across counties and state-wide trends over time.
However, this analysis does not use an empirical model that supports
causal claims. The results should be interpreted as showing
correlational relationships, not causal effects.
# Results
## Figure 1: Wildfire Activity, Insurer Non-Renewals, and FAIR Plan Enrollment Over Time
```{r results-figure-1}
ggplot(time_long, aes(x = year, y = value, color = variable)) +
  geom_line(size = 1.2) +
  geom_point(size = 2) +
  labs(
    title = "Wildfires, Non-Renewals, and FAIR Plan Growth Over Time",
    x = "Year",
    y = "Standardized Values",
    color = "Variable"
  ) +
  theme_minimal()
```
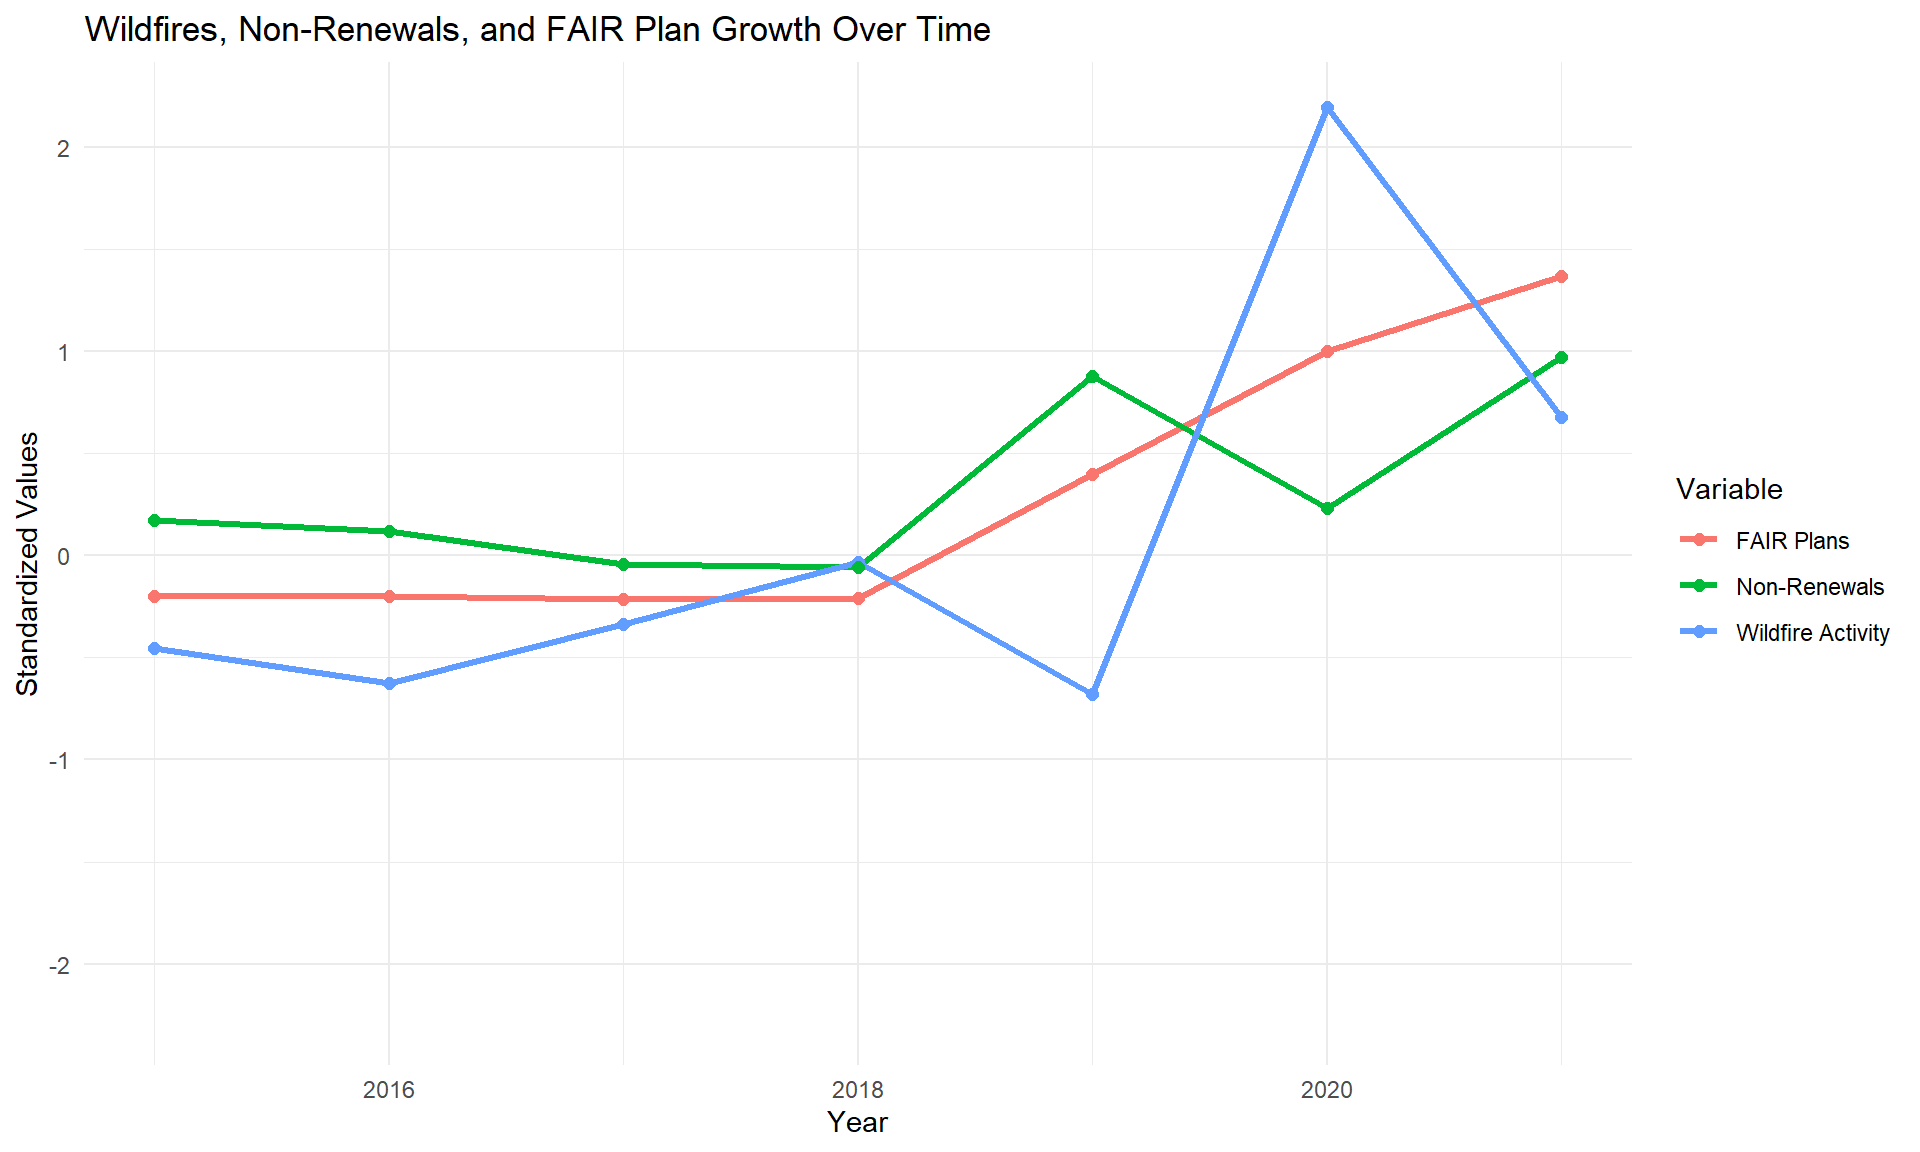
Figure 1 shows a clear pattern over time linking wildfire severity to
insurance market responses. Wildfire activity shows variation over time,
with a large spike in 2020. This reflects one of the most severe
wildfire seasons for California in recent history. This spike is
followed by noticeable increases in both insurer non-renewals and FAIR
Plan enrollment during the following year.
A key pattern in this graph is the lag between wildfire exposure and
insurer behavior. Wildfire activity peaks in 2020, but increases in
non-renewals do not occur until the following year. This is consistent
with the idea that insurers make decisions after observing losses.
Through this lag structure, policy decisions are typically made
annually.
At the same time, FAIR Plan enrollment shows a steady upward trend
throughout the period from 2015 through 2021. This suggests that as
private insurers reduce the number of policies in high-risk areas,
homeowners increasingly rely on FAIR Plan policies as an alternative
form of coverage. These patterns provide initial visual evidence of
interconnected relationships between the key variables: as wildfire risk
increases, insurers withdraw from the market, and FAIR Plan coverage
increases.
## Figure 2: Geographic Distribution of Wildfire Activity, Insurer Non-Renewals, and FAIR Plan Enrollment in California (2021)
```{r results-figure-2}
ggplot(map_long) +
  geom_sf(aes(fill = value_scaled), color = "white", size = 0.2) +
  scale_fill_viridis_c(option = "plasma", na.value = "gray90") +
  facet_wrap(~variable) +
  labs(
    title = "Wildfires, Non-Renewals, and FAIR Plans (Standardized, 2021)",
    fill = "Standardized Value"
  ) +
  theme_minimal() +
  theme(
    panel.grid = element_blank(),
    axis.text = element_blank(),
    axis.ticks = element_blank(),
    strip.text = element_text(size = 6, face = "bold")
  )
```
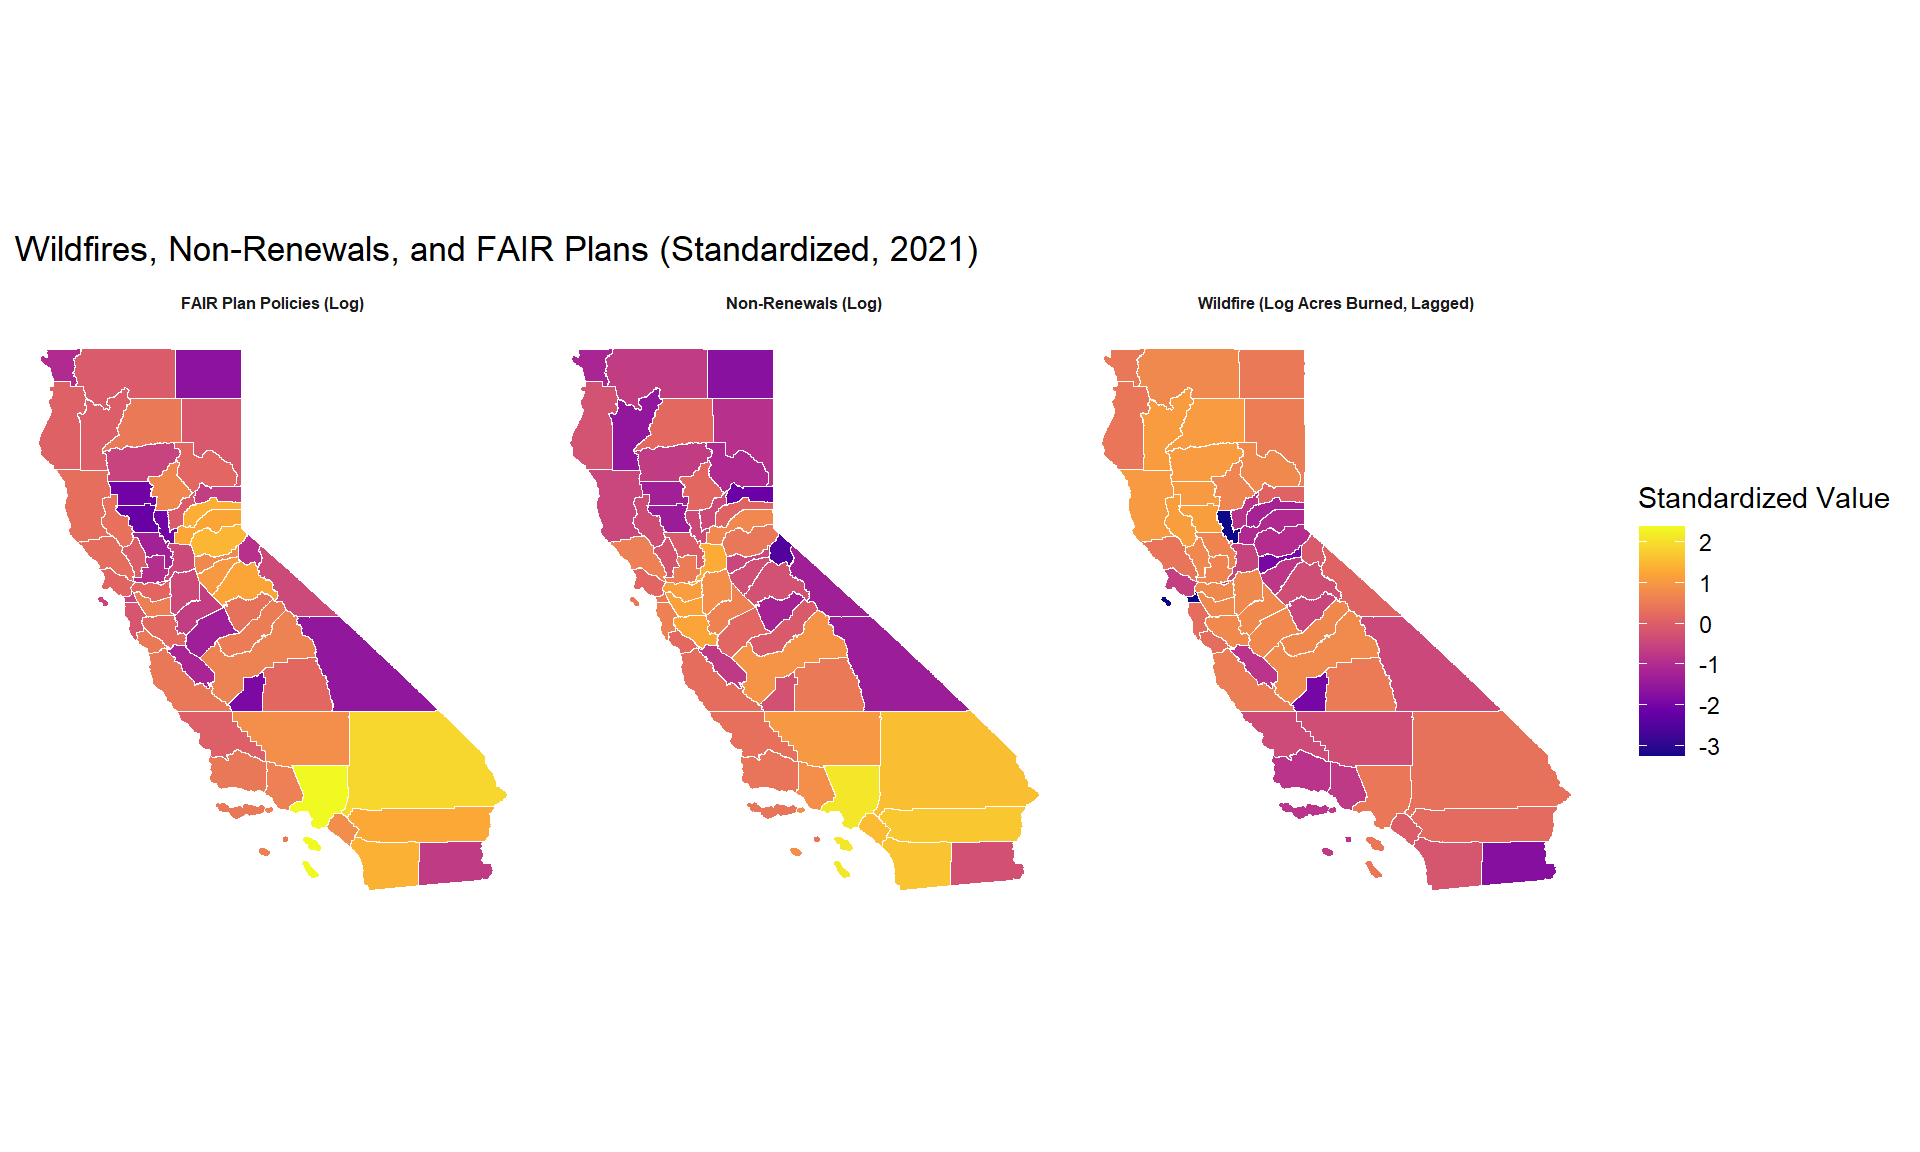
Figure 2 shows the geographic distribution of wildfire activity, insurer
non-renewals, and FAIR Plan enrollment across California counties in
2021. The maps use a color gradient, with darker colors (purple and dark
orange) indicating higher values and lighter colors (yellow and light
orange) indicating lower values.
Overall, the maps show a clear spatial pattern, where counties with
higher wildfire activity also tend to have higher non-renewals and
greater FAIR Plan enrollment. These patterns are concentrated in
high-risk areas instead of being evenly distributed across the state.
This alignment suggests that insurer withdrawal is concentrated in areas
with greater wildfire exposure. FAIR Plan enrollment is also highest in
the same counties, indicating that the FAIR Plan is being used where
private coverage is reduced.
## Primary Fixed Effects Regression Results
```{r results-table-1}
stargazer(model,
          type = "text",
          title = "Fixed Effects Regression Results",
          dep.var.labels = "Log(FAIR Policies)",
          covariate.labels = c("Log(Acres Burned, Lagged)",
                               "Log(Non-Renewals)",
                               "Median Income",
                               "Housing Units",
                               "Median Home Value"),
          omit = c("factor"),
          digits = 3)
```
The primary fixed effects panel regression examines how wildfire
activity and insurer non-renewals affect FAIR Plan enrollment at the
county-year level. It controls for county and year fixed effects as well
as socioeconomic variables.
The key result is a strong and statistically significant relationship
between insurer non-renewals and FAIR Plan enrollment. A 1% increase in
non-renewals is associated with approximately a 1.26% increase in FAIR
Plan policies, holding all other factors constant. This suggests a
strong substitution effect between private insurance and the FAIR Plan.
On the other hand, wildfire activity (lagged acres burned) is not
statistically significant once insurer behavior and the fixed effects
are included. This suggests that wildfire exposure does not directly
translate into FAIR Plan growth, but may affect it indirectly through
insurer decisions.
## Alternative Specification: Insurer Non-Renewals as Outcome Variable
```{r results-table-2}
stargazer(model2,
          type = "text",
          title = "Fixed Effects Regression Results",
          dep.var.labels = "Log(Non-Renewals)",
          covariate.labels = c("Log(Acres Burned, Lagged)",
                               "Log(FAIR Policies)",
                               "Median Income",
                               "Housing Units",
                               "Median Home Value"),
          omit = c("factor"),
          digits = 3)
```
Additionally, insurer non-renewals are used as the outcome variable to
examine whether wildfire activity is directly associated with insurer
withdrawal behavior. FAIR Plan enrollment is not included in this model.
In this model, lagged wildfire activity is statistically significant, but the effect is very small. The coefficient of -0.009 suggests that a 1% increase in lagged acres burned is associated with a 0.009% decrease in insurer non-renewals, holding other factors constant. Although statistically significant, the magnitude of this effect is quite small. When combined with earlier results showing weak and insignificant effects of wildfire activity, this suggests that wildfire exposure does not have a strong direct relationship with insurance outcomes. Overall, this shows that wildfires mainly affect the insurance market through how insurers respond, rather than a direct impact on insurance outcomes.
## Predictive Model Results - Linear Regression
```{r results-table-3}
etable(model_year_fe, model_county_fe, model_both_fe)
```
```{r}
rmse <- sqrt(mean((actual - preds)^2, na.rm = TRUE))

rmse
```
A linear regression model is also used to assess how well the variables
explain FAIR Plan enrollment. Three baseline models are estimated using
only year fixed effects, only county fixed effects, and both fixed
effects. Insurer non-renewals are consistently the strongest predictor
of FAIR Plan enrollment across all three models.
Wildfire activity is not statistically significant in any of the models. This reinforces the earlier results showing a weak direct relationship between wildfire exposure and FAIR Plan enrollment once fixed effects are included. The model fit improves when county fixed effects are added, indicating that differences across counties are important in explaining the model results.
The model is then evaluated using a train-test split (2015-2019 for training and 2020-2021 for testing). The resulting root mean squared error (RMSE) is 1.003. This indicates moderate predictive accuracy. Overall, the predictive model results reinforce the main findings from the fixed effects regression. Non-renewals are directly correlated with FAIR Plan enrollment, while wildfire activity shows a much weaker direct relationship.
# Discussion and Implications
The results suggest that insurer non-renewals are the primary driver of
FAIR Plan enrollment. Wildfire risk may be an underlying factor,
however, its direct effect is weak or inconsistent once county and year
fixed effects are included. The strongest and most consistent
relationship is between non-renewals and FAIR Plan growth. This suggests
that the impacts of wildfires are translated indirectly through insurer
behavior. Instead of responding immediately to wildfire activity,
insurers may adjust their coverage based on broader risk factors, which
leads to increased non-renewals. Households that lose private coverage
then turn to the FAIR Plan. The predictive results also support this
interpretation, as non-renewals are the strongest predictor across all
models.
These findings have important implications for insurance markets and policymakers. They suggest that changes in insurance availability are driven more by insurer responses than by wildfire activity alone. Because of this, policies focused only on reducing wildfire risk may not be sufficient to stabilize the insurance market. The results also emphasize the FAIR Plan’s growth as an insurer of last resort. As non-renewals increase, more households rely on the FAIR Plan, which is typically more expensive with limited coverage. This raises concerns about long term sustainability and access to affordable insurance, especially in high-risk areas. Overall, these findings suggest that insurer withdrawal may reflect future instability in the insurance market, not just current wildfire exposure. This emphasizes the need for policies that consider both risk levels and the factors influencing insurer decisions.
A key recommendation is that policy efforts should focus on reducing insurer non-renewals and stabilizing the private insurance market. One approach is for state regulations to require insurers to maintain coverage in high-risk areas. These regulations could help prevent sharp increases in non-renewals and reduce the number of households forced to enroll in the FAIR Plan. However, this policy change comes with significant tradeoffs. Requiring insurers to remain in high-risk areas may increase their losses, which could lead to increased premiums and reduced profitability. This approach should be used in addition to other measures, such as risk-based pricing and risk mitigation incentives, in order to stabilize the insurance market in the long run. At the same time, policymakers should prepare for continued FAIR Plan growth by potentially expanding coverage to meet demand. However, reliance on the FAIR Plan should still be limited, as it is not a substitute for a stable private insurance market.
# Conclusion
This project examines how wildfire activity affects insurer non-renewals
and how non-renewals, in turn, drive FAIR Plan growth in California. The
main research question is: **How does wildfire activity affect insurer
non-renewals, and how do non-renewals drive FAIR Plan growth?** This
question is important because increasing wildfire risk has raised
concerns about the stability of private insurance markets and the
reliance on the FAIR Plan as an insurer of last resort for homeowners in
high-risk areas. To answer this, the analysis uses a county-year panel
dataset covering all 58 counties in California from 2015 to 2021. The
dataset combines wildfire data from Cal Fire, insurance data from the
California Department of Insurance, and socioeconomic controls from the
U.S. Census Bureau. The empirical approach uses fixed effects panel
regressions with county and year fixed effects, as well as linear
regression with a train-test split to evaluate predictive performance.
The main result is that insurer non-renewals are the strongest and most
consistent predictor of FAIR Plan enrollment, while wildfire activity
has weak or statistically insignificant direct effects once fixed
effects are taken into account. These findings suggest that wildfire
risk affects insurance markets primarily through insurer behavior rather
than directly translating to insurance outcomes. Insurer withdrawal is
the main link between wildfire risk and increased reliance on the FAIR
Plan.
Overall, these results suggest that changes in insurance availability are driven by insurer responses rather than wildfire activity alone. This emphasizes the importance of policies that address insurance market participation, not just environmental risk. State efforts that reduce non-renewals or support insurer participation in high-risk areas may be effective in stabilizing the insurance market in addition to mitigating wildfire exposure. Future research could improve on this analysis by incorporating more specific data, such as zip-code or property level insurance outcomes. It could also use causal identification strategies to more clearly estimate the effect of wildfire exposure. In addition, future research could examine the role of pricing changes and regulatory policy on insurer behavior, as these factors were not directly observed in this dataset.
# References
Auer, M. R. (2024). Wildfire risk and insurance: Research directions for policy scientists. *Policy Sciences, 57*(2), 459–484.
Bayham, J., et al. (2022). The economics of wildfire in the United States. *Annual Review of Resource Economics, 14*, 379–401.
Bergé, L. (2023). *fixest: Fast fixed-effects estimations* (R package).
Boomhower, J., Fowlie, M., & Plantinga, A. J. (2023). Wildfire insurance, information, and self-protection. *AEA Papers and Proceedings, 113*, 310–315.
California Department of Forestry and Fire Protection (CAL FIRE). (n.d.). *Fire hazard severity zones*. Retrieved March 2026, from https://www.fire.ca.gov/
California Department of Insurance. (n.d.). *Data and analysis on wildfires and insurance*. Retrieved March 2026, from https://www.insurance.ca.gov/
California FAIR Plan Association. (n.d.). *Key statistics & data*. Retrieved March 2026, from https://www.cfpnet.com/
Fowlie, M., et al. (2025). *How is climate change impacting home insurance markets?* Brookings Institution.
Garnier, S. (2023). *viridis: Default color maps from 'matplotlib'* (R package).
Hlavac, M. (2022). *stargazer: Well-formatted regression and summary statistics tables* (R package).
Keys, B. (2025). *Housing, climate risk, and insurance*. NBER Working Paper.
Keys, B., & Mulder, P. (2025). *Property insurance and disaster risk: New evidence from mortgage escrow data*. NBER Working Paper.
OpenAI. (2026). *ChatGPT (GPT-5.5) [Large language model]*. Retrieved May 13, 2026, from https://chat.openai.com/
Pebesma, E. (2018). *Simple features for R: Standardized support for spatial vector data*. *The R Journal, 10*(1), 439–446.
Rudis, B. (2020). *hrbrthemes: Additional themes, theme components, and utilities for 'ggplot2'* (R package).
State of California. (n.d.). *CA geographic boundaries*.
U.S. Census Bureau. (n.d.). *American Community Survey*. Retrieved March 2026, from https://www.census.gov/
Vincent Arel-Bundock. (2023). *modelsummary: Data and model summaries in R* (R package).
Walker, K. (2023). *tigris: Load census TIGER/Line shapefiles* (R package).
Waring, E., Quinn, M., McNamara, A., Arino de la Rubia, E., Zhu, H., & Ellis, S. (2023). *skimr: Compact and flexible summaries of data* (R package).
Wickham, H. (2016). *ggplot2: Elegant graphics for data analysis*. Springer-Verlag New York.
Wickham, H. (2023). *tidyr: Tidy messy data* (R package).
Wickham, H., et al. (2019). *Welcome to the tidyverse*. *Journal of Open Source Software, 4*(43), 1686.
Wickham, H., François, R., Henry, L., & Müller, K. (2023). *dplyr: A grammar of data manipulation* (R package).